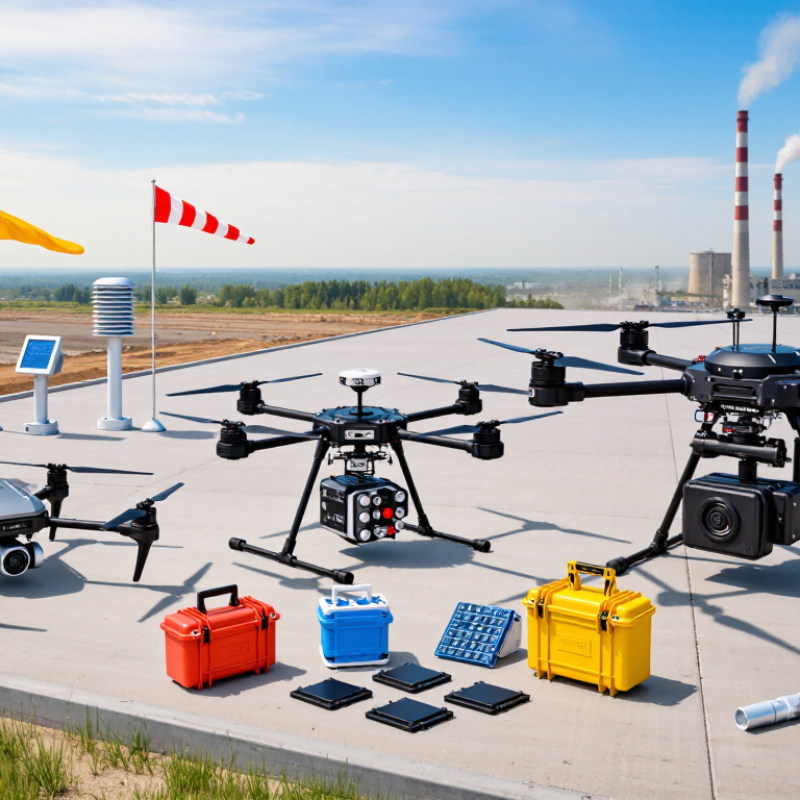
How to Choose Air Pollution Detection Drones?
Choosing Air Pollution Detection Drones is not simply a matter of comparing flight times or camera quality. The right platform must carry sensors suited to the pollutants you need to measure, while remaining stable enough to collect useful readings. A compact drone may work well near a monitoring site, but it may lack the payload capacity for several instruments. Larger models can carry more equipment, though they often need more battery power and careful setup. Small details matter.
Before comparing models, define the monitoring task. Are you mapping particulate matter around a construction area, checking gas concentrations near an industrial site, or observing changes across a wider region? Each task can require different sensors, sampling methods, and flight patterns. Sensor calibration, inlet placement, wind, humidity, and temperature can all affect results. A drone does not make imperfect measurements reliable by itself. That is easy to overlook.
This guide explains how to assess payload capacity, sensor compatibility, flight endurance, data quality, and the software used to review results. It also considers maintenance, operator training, and applicable local flight requirements. Look for published sensor specifications and documented testing, not just broad marketing claims. When possible, compare drone readings with a trusted ground-level reference. Even then, the comparison may not be exact; conditions can change between measurements. Choosing well means matching equipment to the question, then being honest about what the collected data can—and cannot—show.
Define Monitoring Goals and Identify Target Pollutants
How to Choose Air Pollution Detection Drones?
Define Monitoring Goals and Identify Target Pollutants
Start with the question. What decision should the measurements support? A school may need to track roadside pollution during pickup hours. A site manager may want to locate dust near a loading area. These goals affect flight routes, sampling times, and sensor choices. Be specific about where and when readings matter. “Measure air quality” is too broad to guide a useful survey.
List the pollutants linked to the concern. Fine particles, such as PM2.5, may suit a dust or smoke study, while nitrogen dioxide can help assess traffic-related patterns. Ozone, sulfur dioxide, carbon monoxide, and volatile organic compounds require different sensing methods. One sensor rarely measures everything well. Check its detection range, response time, and performance under expected temperature and humidity. A humid morning can affect particle readings. So can a poorly planned flight height. Compare drone measurements with a trusted reference instrument when possible; the comparison may reveal gaps in your plan.
Tips: Write down the pollutant, location, height, time window, and acceptable uncertainty before choosing equipment. Keep a simple field log, including weather and calibration checks. Real-world readings can be messy, and even a careful setup may need revision after the first flights.
Select Sensors for the Required Measurements
The right sensor depends on the question your drone must answer. Measuring particulate matter is different from detecting ozone, nitrogen dioxide, or volatile organic compounds. A compact optical particle counter can track changes in dust and smoke, while gas sensors need to match the specific compounds of interest. Avoid choosing by sensor count alone. More channels can mean more weight, power use, and data to interpret.
Check each sensor’s detection range, response time, and sensitivity to other gases. Temperature and humidity can shift readings, especially during rapid changes in altitude. That matters. Review the operating conditions, then compare the sensor’s stated performance with the levels you expect to measure. Ask how often calibration is needed and whether the sensor can be checked against a reliable reference instrument. No sensor is perfect. A low-cost unit may reveal useful patterns, but it may not support precise concentration estimates without careful validation.
The inlet and flight plan matter too. A poorly placed inlet can sample air disturbed by the drone’s propellers, and fast climbs may leave slow sensors lagging behind. Keep the inlet clear, record flight height and weather, and test the setup near the ground before relying on airborne results. One detail is easy to miss: sensor performance in a lab may not match a vibrating drone in changing air. Document that uncertainty alongside the measurements.
Match Drone Type to Flight Range and Payload Needs
Choosing an air pollution detection drone starts with the route, not the sensor catalog. A multirotor can hover beside a road junction or follow a short vertical profile near a building. That control helps when readings must be tied to specific heights and locations. Hover time matters. Longer surveys may require several battery changes.
For broad, linear surveys, a fixed-wing drone can often cover more ground per flight, but it needs space to launch and land. It also cannot hover over a plume. A hybrid aircraft offers vertical takeoff and longer-range flight, though its added systems can mean more weight and maintenance. Match the aircraft to the sampling plan: a compact gas sensor, inlet tubing, pump, and data logger all reduce available flight time. That adds weight.
Check the full payload, including cables and mounts, against the drone’s usable capacity. Then estimate range with wind, temperature, and return reserves in mind. A spreadsheet estimate can look precise and still miss real-world battery loss. Test the complete setup on a short route first. Compare sensor readings with a ground instrument, and record altitude, speed, and weather alongside each measurement. Without those details, a long flight may produce plenty of data but little useful context.
Assess Data Quality, Calibration, and Mapping Capabilities
An air-pollution drone is only as useful as the measurements it collects. Check that its sensors detect the pollutants you care about, such as fine particles or nitrogen dioxide, and review their detection limits and response times. A sensor that updates slowly may miss a narrow roadside plume. Ask how readings are affected by humidity, temperature, vibration, and the drone’s own airflow. Small details matter.
Calibration deserves equal attention. Look for a documented procedure, a clear calibration interval, and records showing when checks were completed. Before fieldwork, compare the drone’s readings with a trusted reference instrument under similar conditions. Repeat the check after flights, especially if readings drift or conditions change. A neat dashboard cannot fix a poorly calibrated sensor. I would also question results that look unusually consistent; real air rarely behaves so neatly.
Mapping capabilities determine whether measurements can be interpreted later. Confirm that each reading is linked to accurate GPS coordinates, altitude, and time, then check whether the software can export data for mapping and analysis. A useful map should show sampling gaps, not hide them. For example, a street-level route flown at changing heights can make pollution hotspots appear misleadingly precise. Review the flight path and metadata alongside the color scale. Still, no map tells the whole story. Wind shifts, traffic pulses, and missed samples can all shape the pattern, so keep those limits visible in the final dataset.
How to Choose Air Pollution Detection Drones? — Assess Data Quality, Calibration, and Mapping Capabilities
| Evaluation dimension | What to check | Practical benchmark or evidence | Why it matters |
|---|---|---|---|
| Pollutants measured | Confirm the sensor measures the pollutants relevant to the survey, such as PM2.5, PM10, ozone, nitrogen dioxide, carbon monoxide, or sulfur dioxide. | Check the sensor’s stated measurement range, units, detection limit, and intended operating conditions for each pollutant. | A drone is useful only if its payload measures the target pollutant at concentrations expected at the site. |
| Measurement accuracy and uncertainty | Review accuracy, precision, detection limit, response time, and uncertainty across the intended concentration and temperature ranges. | Request test results or validation data from co-location with an appropriate reference or equivalent method. Compare results across low and high concentrations, not just a single point. | A precise-looking map can still be misleading if sensor uncertainty is large or poorly characterized. |
| Particulate-matter data quality | For optical particle sensors, check how the system handles relative humidity, aerosol composition, and particle-size assumptions. | Look for documented co-location or correction procedures. Optical readings can be affected by humidity and particle properties, so correction performance should be validated for the survey conditions. | Uncorrected environmental effects can cause apparent changes in PM readings that are not changes in pollution. |
| Gas-sensor selectivity | Ask about cross-sensitivity to other gases, temperature and humidity effects, drift, and any required environmental compensation. | For electrochemical sensors, request interference tests and calibration records for the target gas and relevant interfering gases. | A sensor may respond to more than one gas; without selectivity checks, readings can be attributed to the wrong pollutant. |
| Calibration and traceability | Determine how zero checks, span checks, calibration, and sensor replacement are handled and documented. | For gas measurements, check whether calibration uses certified gas standards and whether calibration records identify date, concentration, and sensor. Establish calibration frequency from the sensor guidance and observed drift. | Calibration supports comparable measurements over time and helps identify drift before it compromises a survey. |
| Co-location and field validation | Check whether the complete drone-mounted system has been compared with a suitable stationary reference monitor under representative conditions. | Ask for paired data, agreement statistics, the tested concentration range, and details of the sampling setup. Repeat checks after major maintenance or sensor changes. | Validation of the assembled payload captures effects from airflow, vibration, inlet placement, and data processing. |
| Sampling rate and response time | Compare sensor response time and logging frequency with the drone’s speed and the spatial detail required. | Check whether readings are time-stamped at a documented rate and whether sensor lag is measured or corrected. A fast flight can travel a substantial distance while a slow-response sensor is stabilizing. | Sampling and response limitations determine how well the system can resolve small pollution gradients. |
| Position and time synchronization | Verify that pollutant readings are synchronized with GNSS position, altitude, and time from a common or documented clock. | Check the stated position accuracy and whether it is horizontal or three-dimensional. RTK GNSS can provide centimeter-level positioning in suitable conditions, but actual performance depends on correction availability, satellite visibility, and setup. | Position or timing errors can place valid readings in the wrong map location. |
| Mapping and spatial resolution | Assess flight-path planning, waypoint control, altitude control, georeferencing, and how point measurements are turned into map layers. | Request sample outputs showing flight tracks, measurement locations, interpolation method, map scale, coordinate reference system, and uncertainty or data-density indicators. Map resolution should not imply more detail than the sampling supports. | A clear map should communicate both where measurements were made and where values are estimated between measurements. |
| Altitude and vertical profiling | Check whether the system records altitude consistently and supports repeatable measurements at planned heights. | Confirm the altitude reference used, such as height above takeoff point or a mapped elevation reference, and review test flights that repeat vertical profiles. | Pollutant concentrations can vary with height; unclear altitude references make profiles difficult to interpret or reproduce. |
| Meteorological context | Determine whether temperature, relative humidity, pressure, wind speed, and wind direction are measured or recorded from an appropriate nearby source. | Review the time and location of weather observations and include these variables in the exported dataset where available. | Weather affects pollutant transport and can influence sensor readings, so it is important context for interpreting a map. |
| Data completeness and quality flags | Check how missing, invalid, out-of-range, warm-up, calibration, and sensor-fault readings are identified. | Require raw data, timestamps, units, sensor status, quality flags, and processing notes in an exportable format such as CSV or another documented data format. | Transparent quality flags make the results auditable and help prevent invalid data from being mapped as valid observations. |
| Repeatability and survey design | Check whether routes, speed, altitude, sensor warm-up, and sampling procedures can be repeated consistently. | Plan repeat passes or stationary checks and document flight conditions so differences between surveys can be assessed fairly. | Repeatable procedures help distinguish real pollution changes from changes in the measurement setup. |
| Data processing and transparency | Review filtering, averaging, calibration corrections, interpolation, and any automated removal of outliers. | Ask for a written description of processing steps and access to unprocessed readings where possible. Confirm that map legends state units and averaging periods. | Documented processing makes results easier to verify, compare, and reproduce. |
| Overall selection decision | Compare candidates against the target pollutants, required spatial scale, operating environment, validation evidence, and data-export needs. | Prefer systems with pollutant-specific validation, documented calibration, synchronized geolocation, transparent quality flags, and mapping outputs that disclose sampling density and uncertainty. | The best choice is the system that can produce defensible data for the intended survey—not simply the one with the most sensors or the most detailed-looking map. |
Note: Benchmarks and procedures should be matched to the sensor specifications, local conditions, and purpose of the survey. A drone-based screening map should not automatically be treated as a regulatory compliance measurement.
Compare Safety, Regulatory, and Operating Requirements
How to Choose Air Pollution Detection Drones? Compare Safety, Regulatory, and Operating Requirements
A useful drone is not simply one that carries a sensor. It must collect repeatable readings without putting people or aircraft at risk. Start with the operating site: rooftops, trees, power lines, and changing wind can limit safe flight paths. In the United States, FAA Part 107 generally requires the remote pilot to keep the aircraft within visual line of sight. Requirements differ elsewhere, so verify local aviation rules, airspace limits, pilot qualifications, and permissions before planning a survey. Keep a clear landing area. Small details matter.
Match the sensor to the question. A particulate sensor used to map hotspots may not provide regulatory-grade measurements. The U.S. EPA’s Air Sensor Guidebook stresses performance evaluation and careful use of sensor data. WHO’s 2021 air quality guidelines set annual PM2.5 at 5 µg/m³ and 24-hour PM2.5 at 15 µg/m³. Those benchmarks show why calibration, sampling duration, and weather notes matter. Humidity can affect readings. Record it.
Check payload weight, battery endurance, and how long the sensor needs to stabilize. A short flight may miss a plume or produce too few samples. Compare results with a fixed monitor when possible, and document calibration dates, flight height, wind, and sensor settings. Treat drone maps as screening evidence unless the method has been validated for the intended use. I would not trust a neat heat map alone. One awkward limitation: gusts can make repeated routes less comparable than they look.
English
Français